
Passion-Driven Statistics and Evaluating Claims: A Simple First Tool for Decisions
Students ask if there a real connection between two features of the world—or just a coincidence? They learned the basics of comparing observed and expected outcomes.


This week, I interacted with chatGPT to develop a structured activity using sample data and an engaging job interview approach. Here is one way to think about it:
A test for independence allows us to check if two categorical features of the world are connected. It compares what we expect to see with what we actually see in the data if there's no relationship.
If the difference is big enough, the test can provide evidence as students reason with numbers (i.e. these two things may be connected).
If not, it says: Looks like this might be just by chance.
Students enjoyed this activity because it gave them repeated practice with the idea in the context of a job interview. Here is an example.
Week 9 Activity: The Chi-Squared Interview — Are These Two Things Connected?
A Real-World Job Interview Simulation for Graduating Business Majors
📅 Complete before class on Wednesday.
Instructions
Hi everyone — we won’t have a lecture this week, so everything you need is right here in this activity. You’ll work through a full data analysis using Excel and explain what your results mean in plain English.
You’ll be acting like a business analyst:
Can you tell if two things are connected, or is the pattern just random?
What You’ll Create
By the end of this activity, you’ll complete the following:
✅ A Pivot Table with observed counts
✅ A new table with expected counts (using Excel formulas)
✅ A calculation for the Chi-Squared Test Statistic
✅ A p-value using Excel
✅ A 1-minute elevator pitch summarizing your result
The Scenario
You’ve made it to the final-round interview at Insight Analytics Inc.
They hand you a small dataset and ask:
“Is there a connection between how close teens feel to their mom and how often they lose focus in school?”
You’ll use Excel and a Chi-Squared Test for Independence to answer the question. No memorized formulas needed — just logic, math, and storytelling.
📁 Your Dataset
Download this file from Moodle.
You’ll use these two columns:
Feel Close to Mom: Very Close, Somewhat Close, Not Very Close
Trouble Paying Attention: Never/Rarely, Sometimes, Often/Every Day
There are 60 total responses.
🧮 Step-by-Step Instructions (with Notes)
✅ Progress Tracker
✅ Step 1 → Make a Pivot Table
🔲 Step 2 → Create Expected Counts
🔲 Step 3 → Calculate Differences (Test Statistic)
🔲 Step 4 → Get the p-value
🔲 Step 5 → Interpret the result
🔲 Step 6 → Write your pitch
🔢 Step 1: Make Your Observed Counts Table
🎯 What you’re doing:
Counting how many people fall into each combination of answers. These are your observed counts — what actually happened in your sample.
🧠 Why this matters:
This is your starting point. You’ll compare these real numbers to the numbers you’d expect if the two behaviors were unrelated.
🛠 In Excel:
Highlight the data (including headers)
Click Insert → PivotTable → then OK
In the PivotTable Fields:
Drag Feel Close to Mom into Rows
Drag Trouble Paying Attention into Columns
Drag either variable into Values → set to Count
This gives you a 3×3 table that shows how many people fall into each combination.
🎯 Step 2: Create Your Expected Counts Table
🎯 What you’re doing:
Figuring out what counts we’d expect in each box if the two variables had no relationship at all.
🧠 Why this matters:
If there’s no connection, the table should follow the row and column totals. The expected counts show what “random chance” would look like.
🧮 Formula:
Expected Count = (Row Total × Column Total) ÷ Grand Total
📌 You’ll do this for each of the 9 cells in the table.
📊 Example Expected Counts Table (from your dataset)
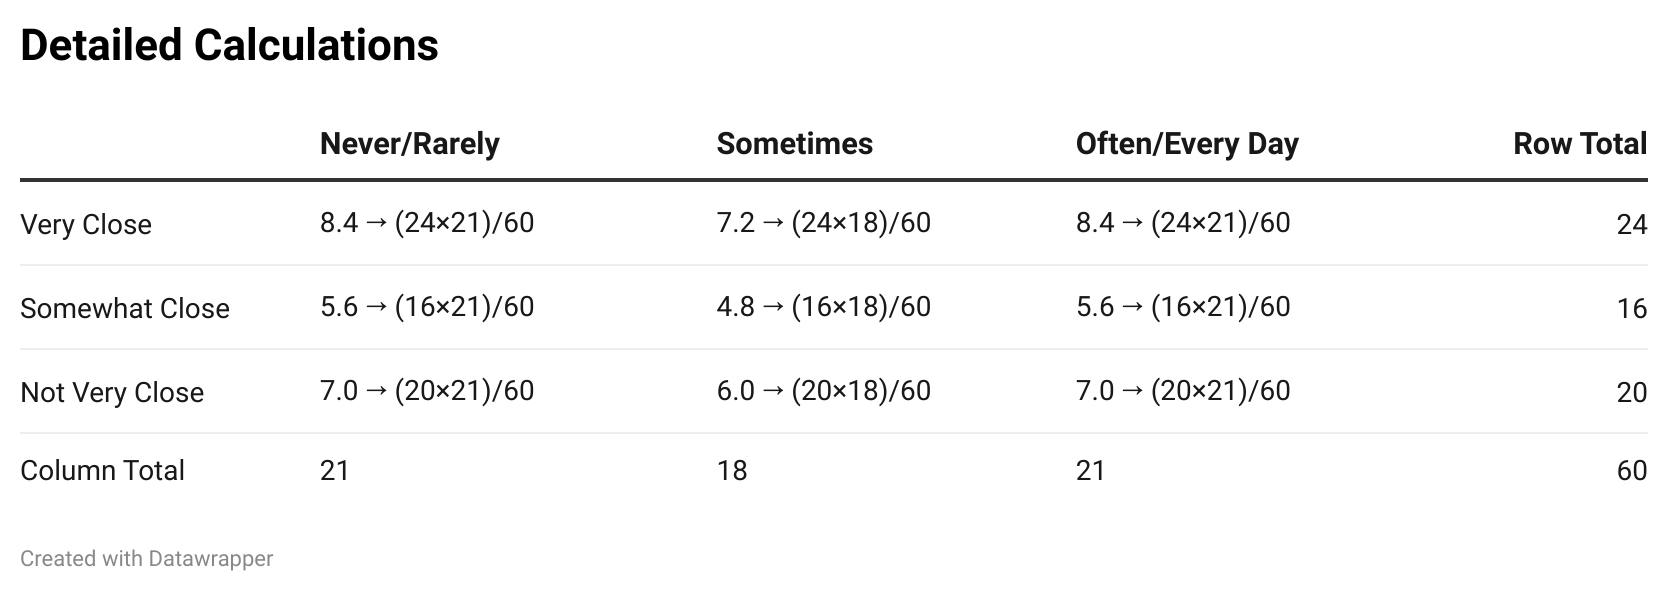
Note: These numbers come from the exact dataset provided. Use Excel formulas to recreate them.
🛠 In Excel:
Make a new table next to your Pivot Table or on a new sheet.
Use this formula:
=(Row_Total * Column_Total)/60
Now you have your Expected Counts Table.
⚖️ Step 3: Calculate the Chi-Squared Test Statistic
🎯 What you’re doing:
Measuring how different the observed and expected counts are. A bigger difference = more evidence that the two variables might be related.
🧠 Plain English:
The test statistic is just one number that tells you how far off the actual data is from what you'd expect by chance.
🧮 Formula for each cell:
(Observed – Expected)² ÷ Expected
✅ Example:
Observed = 12, Expected = 8.4
→ (12 – 8.4)² ÷ 8.4 = (3.6)² ÷ 8.4 = 1.54
✅ After calculating this for all 9 cells and adding them up, you get:
✅ Chi-Squared Test Statistic = 10.06
📉 Step 4: Calculate the p-value
🎯 What you’re doing:
Checking whether the difference between observed and expected counts is big enough to be unlikely due to chance.
🧠 Plain English:
The p-value tells you the probability that the differences happened randomly. Smaller = stronger evidence.
🛠 In Excel:
Use this formula:
=CHISQ.DIST.RT(10.06, 4)
✅ This gives a p-value of about 0.04
Use this formula if you want to calculate the p-value directly from the observed counts and the expected counts. This allows you skip STEP #3.
=CHISQ.TEST(B$5:D$7,B$13:D$15)
🧠 Step 5: Interpret Your Result
🎯 What you’re doing:
Explaining what your p-value means.
✅ p-value = 0.04
That’s less than 0.05, so there is strong evidence that the two behaviors are related.
🎤 Step 6: Write Your Elevator Pitch
🎯 What you’re doing:
Summarizing what you found and what it means — in under a minute.
🧠 Who it’s for:
A manager who wants plain-language answers, not stats jargon.
✅ Your Pitch Should Answer:
What question you were testing
What the p-value was
What that means and what you recommend
✅ Example Pitch
I tested whether students who feel closer to their moms are more focused in school. The Chi-Squared Test gave a statistic of 10.06 and a p-value of 0.04. That’s below the 0.05 threshold, which means we have strong evidence that the two behaviors are related. It’s likely that feeling close to a parent is linked to better focus in school.
✅ What to Submit on Moodle
📷 A screenshot or photo of your:
Pivot Table (Observed Counts)
Expected Counts Table (formulas visible)
Chi-Squared Test Statistic
p-value
🗣️ Your 1-minute elevator pitch (typed into the Moodle text box)
Following four weeks: We have our last exam for the semester scheduled for next week and are moving into high gear to complete the PDS poster and prepare for one-minute presentations during the last week of class! We will study ANOVA and CORRELATION for two features of the world.
The PDS structure has helped focus the class on developing an end product students can be proud of. The interview setting was a big hit.