
Using Passion-Driven Statistics, 3rd Edition
This spring, I am teaching an introductory statistics class in our business school and using a National Science Foundation supported curriculum. Now is a good time to writing about what I learn.

We are just starting our Spring Term (Last Friday) after our University’s Winter term ended in January.
I am teaching an introductory business statistics course (ECO 2300 Statistics for Decision Making). As part of the class, I am experimenting with an introductory project-driven curriculum called “Passion-Driven Statistics.” The developers describe the curriculum this way:
The curriculum supports students to work with existing data covering psychology, health, business, government, education, environmental science, biology and more. From existing data, you’ll be able to pose questions of interest to you and then use statistical software (e.g., SAS, R, Python, Stata, or SPSS) to turn raw data into useful information.
My colleague, Dr. Olivia Healy, suggested I attend one of the workshops to learn about the curriculum and instructional materials. I was quite impressed with the work that had been done and the class prep materials that were available.
In a nutshell, Passion-Driven Statistics offers a scaffolded semester project framework that can easily be adapted to your course needs. I am currently using it as a supplement to the main topics for my course.
For week one, we reviewed the project introduction, downloaded Anaconda (Python Distribution and Anaconda Navigator), and started exploring the codebook for the Add Health Data Set we will use for the project.
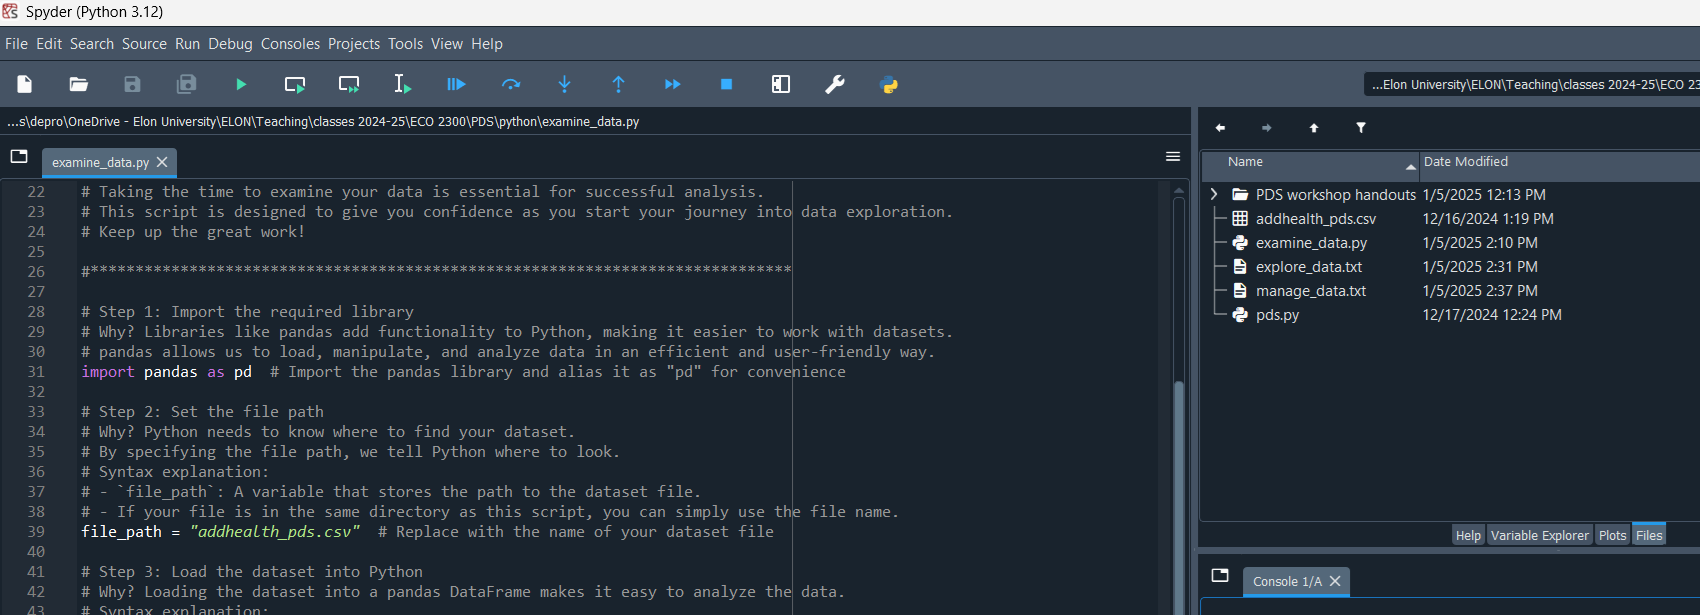
Today, we will have our first lab, where students select two variables and draft a research question about the association between the two variables. Students will also write their first Python script to read the CSV file into a dataframe and perform basic print commands.
import pandas as pd
df = pd.read_csv('file_path.csv')
Next week, I’ll share and reflect on what I learned. Wish me luck!